Original Source: http://bit.ly/2dqUC3A
Joshua Mayers October 18, 2016
We recently released our inaugural PitchBook-NVCA Venture Monitor as a comprehensive resource on all matters venture capital. You can download the full 20-page report for free, but if you’d like to fast forward to the highlights, we’ve collated the top charts below:
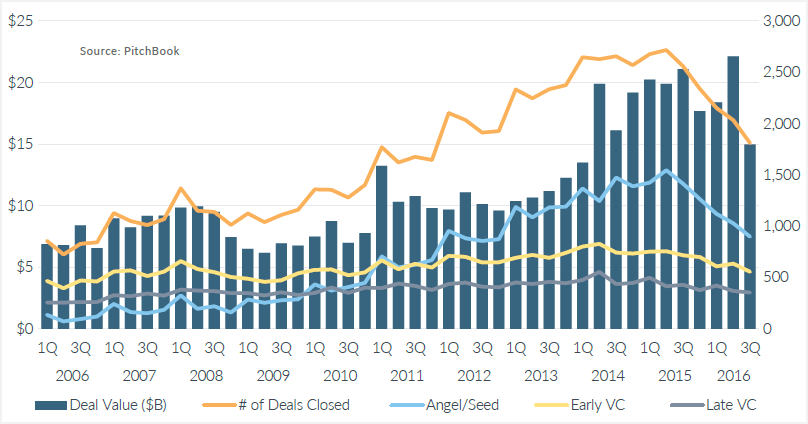
US venture capital activity by quarter
3Q numbers show the venture reset is ongoing, though the decline in deal flow has been softer than some expected. At this pace, year-end VC invested could hit $74 billion—the second-highest tally of the decade.
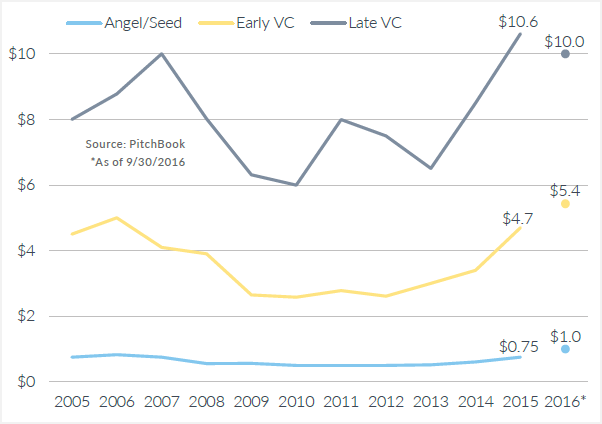
Median VC round size ($M) by stage
Median financing sizes still remain at near-record levels through 3Q, with only late-stage deals on the decline—ever so slightly—from 2015’s mark.
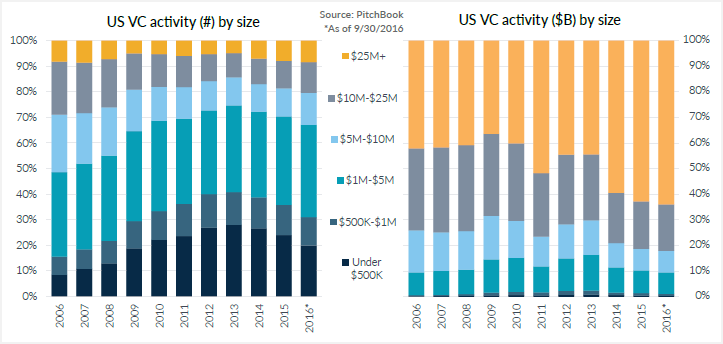
US venture capital activity by size
Larger financings continue their trend upward, both in the percentage of the deal count and capital invested. Nearly 70% of 2016 investments have been of $1 million or more, the highest since 2009.
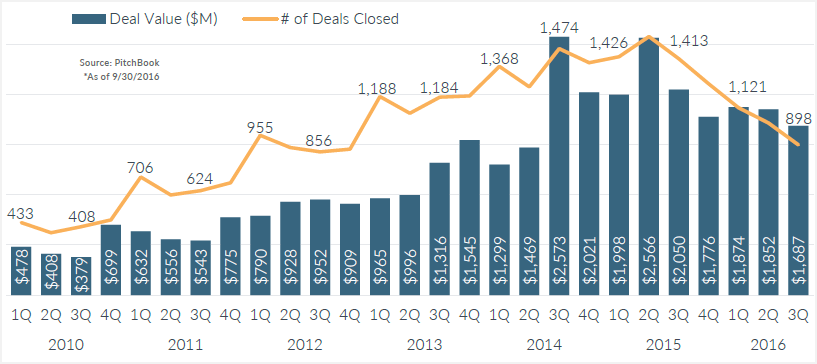
Angel & seed activity in the US
The dramatic fall since 2Q 2015 must be contrasted with historical norms. Capital invested through angel deals in 3Q was higher than any quarter prior to 3Q 2014, and overall activity holds strong against pre-2013 levels.
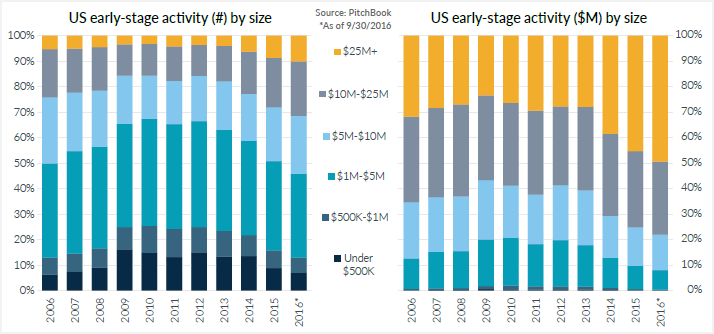
US early-stage VC activity by size
The portion of early-stage deals sized at $10 million or more is over 30% in 2016, the largest percentage in more than a decade. 165 deals this year have closed on over $25 million.
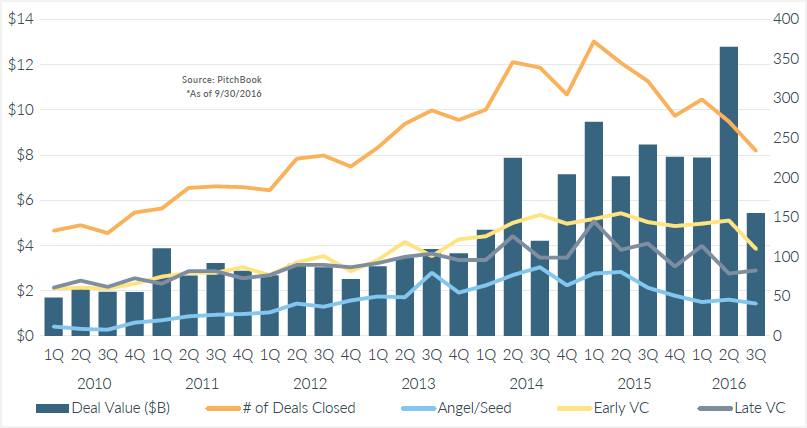
US late-stage VC activity by quarter
Late-stage transactions have exemplified similar trends to what we’ve seen across the entire industry, where total activity has fallen but investors have placed more capital with select stand-out companies.
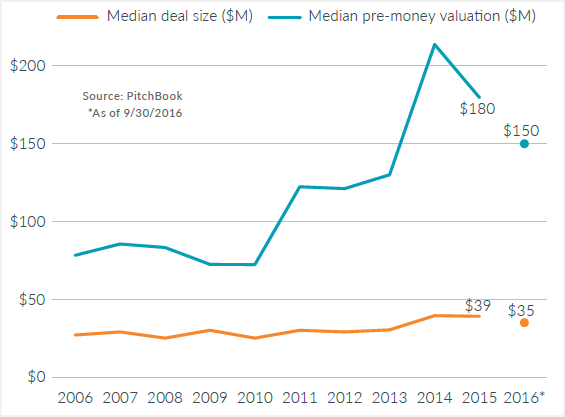
US growth equity activity
In a new dataset to our quarterly venture report, growth equity deal sizes and pre-money valuations both dropped compared to last year.
Note: Growth equity is not included as a subset of overall VC data but is rather its own unique dataset. A full explanation of the methodology for these rounds is available in the report.
US VC activity with corporate VC participation
2015 saw an unprecedented $32.9 billion worth of transactions that included corporate VCs; through September, this year has already seen $26.1 billion.
US venture capital activity by sector
Our industry groups have adjusted slightly from previous reports but the trends remain. All industries are offpace in terms of total deal count, while software continues to drive overall capital invested.
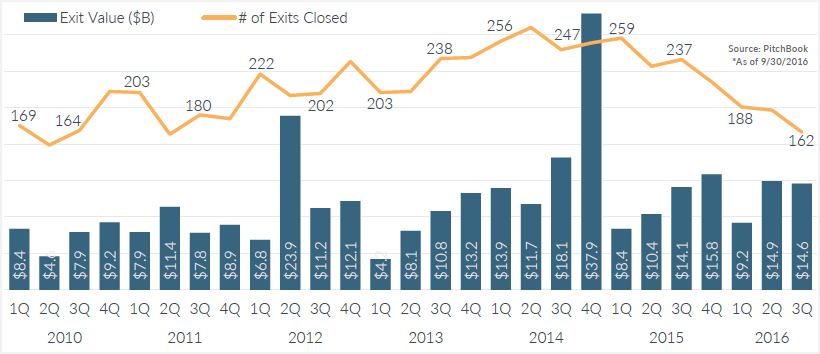
US venture-backed exit activity by quarter
Through 3Q, this year has seen VCs achieve $38.6 billion in liquidity, putting exit value on pace to come in over what we saw in 2015, although total volume is on pace to come in lower for the second-straight year.
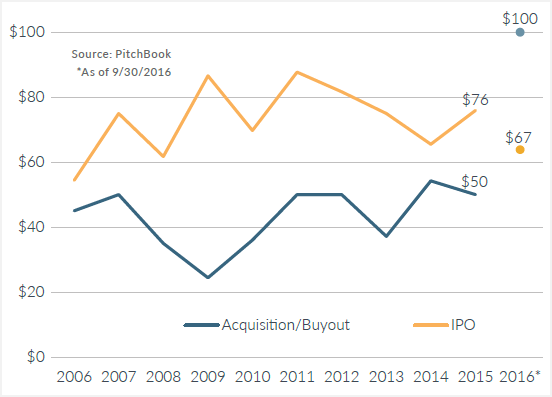
Median US venture-backed exit size ($M) by type
The median acquisition/buyout exit size hit a new historic high of $100 million last quarter; that figure has doubled in size from what we saw in 2015.
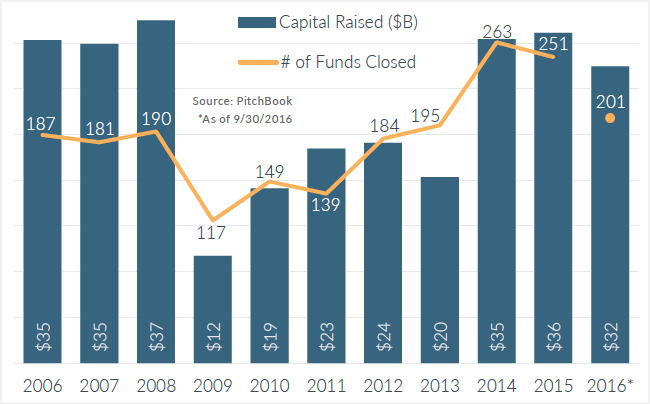
US venture capital fundraising by year
$32.4 billion has been raised so far, putting 2016 on pace to raise the most since the dot-com era. The huge amount collected this year may be due in part to the oversized returns realized by the industry of late.
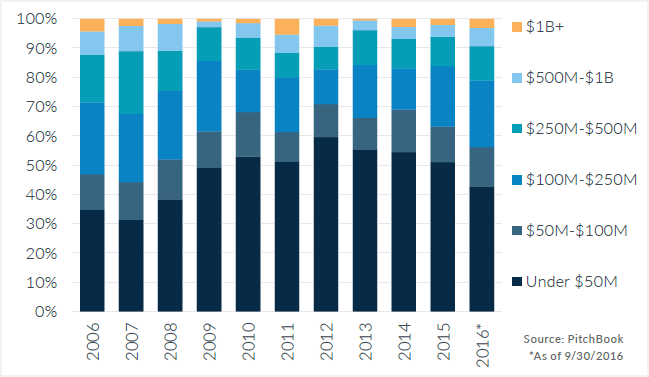
US VC fundraising (#) by size
More than 40% of funds closed so far this year have collected commitments of $100 million or more, a rate not seen since before the financial crisis.
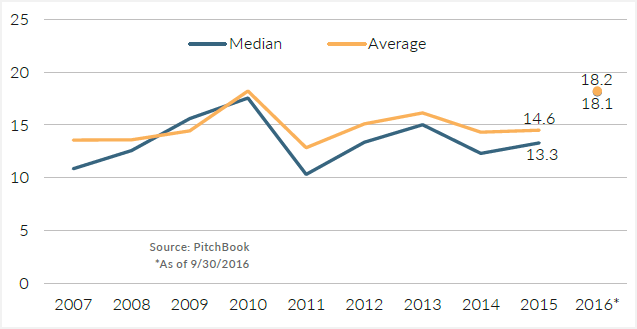
US VC funds’ time to close (months)
The median time to close a VC fund in 2016 has jumped 36% YoY to over 18 months, the first time it has been that high. Not pictured: Median fund step-up sizes are trending at 1.4x for the second year in a row.
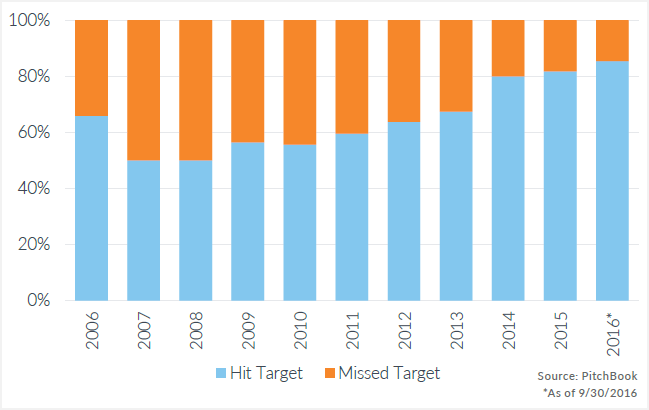
US VC funds (#) hitting target
85.4% of this year’s closed funds are hitting their target, a 3.6% jump from a year ago and a 29.8% climb from 2010—emphasizing that LP confidence in venture remains high.
For deeper analyses of these trends, be sure to check out the full report.

