Original Source: http://pitchbook.com/news/articles/a-visual-summary-of-vc-activity-in-2015-datagraphic
January 11, 2016
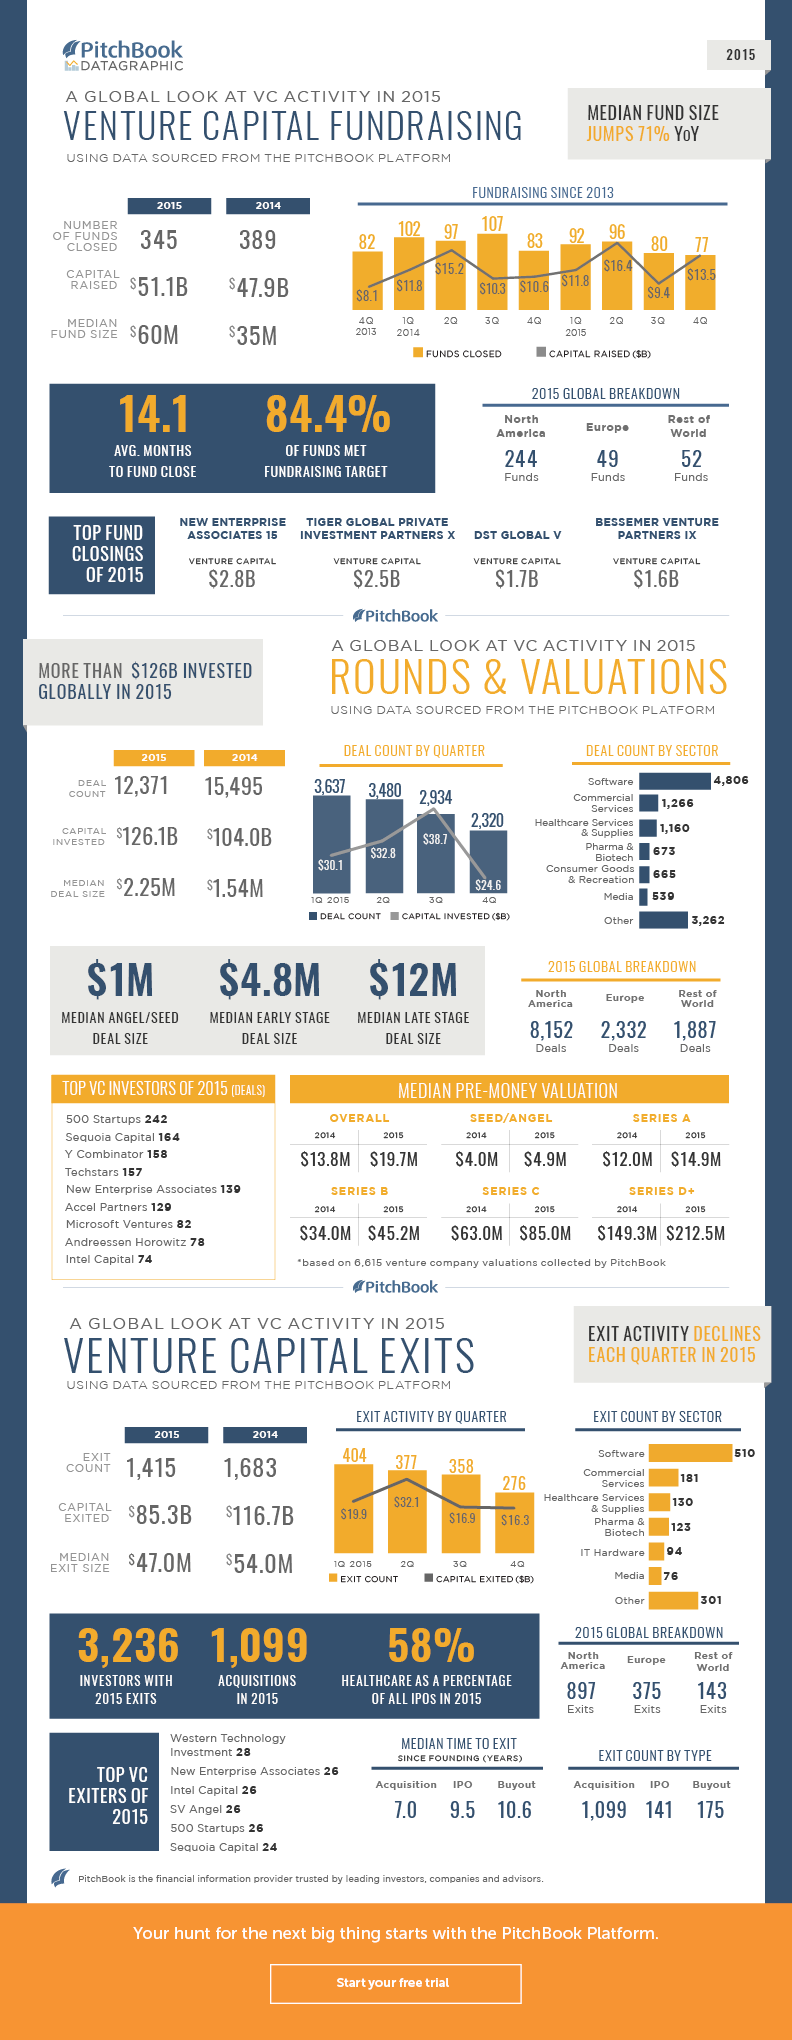
As we continue the release of our popular year-end datagraphics, posted below is a look at global venture capital fundraising, dealmaking and exit trends from 2015.
Venture fundraising remained healthy with $51 billion+ in commitments collected; median fund size was up 71% compared to last year and 89.3% of vehicles met their initial fundraising targets. On the dealmaking side, an industry-wide jump in valuations slowed overall activity. Exits dropped on all fronts from 2014’s massive numbers, particularly public offerings.
For the full rundown of global VC activity last year, check out the datagraphic below.
Follow more of our 2015 in Review coverage by clicking here.


